Dashboard Walk-Through #
Video Walkthrough #
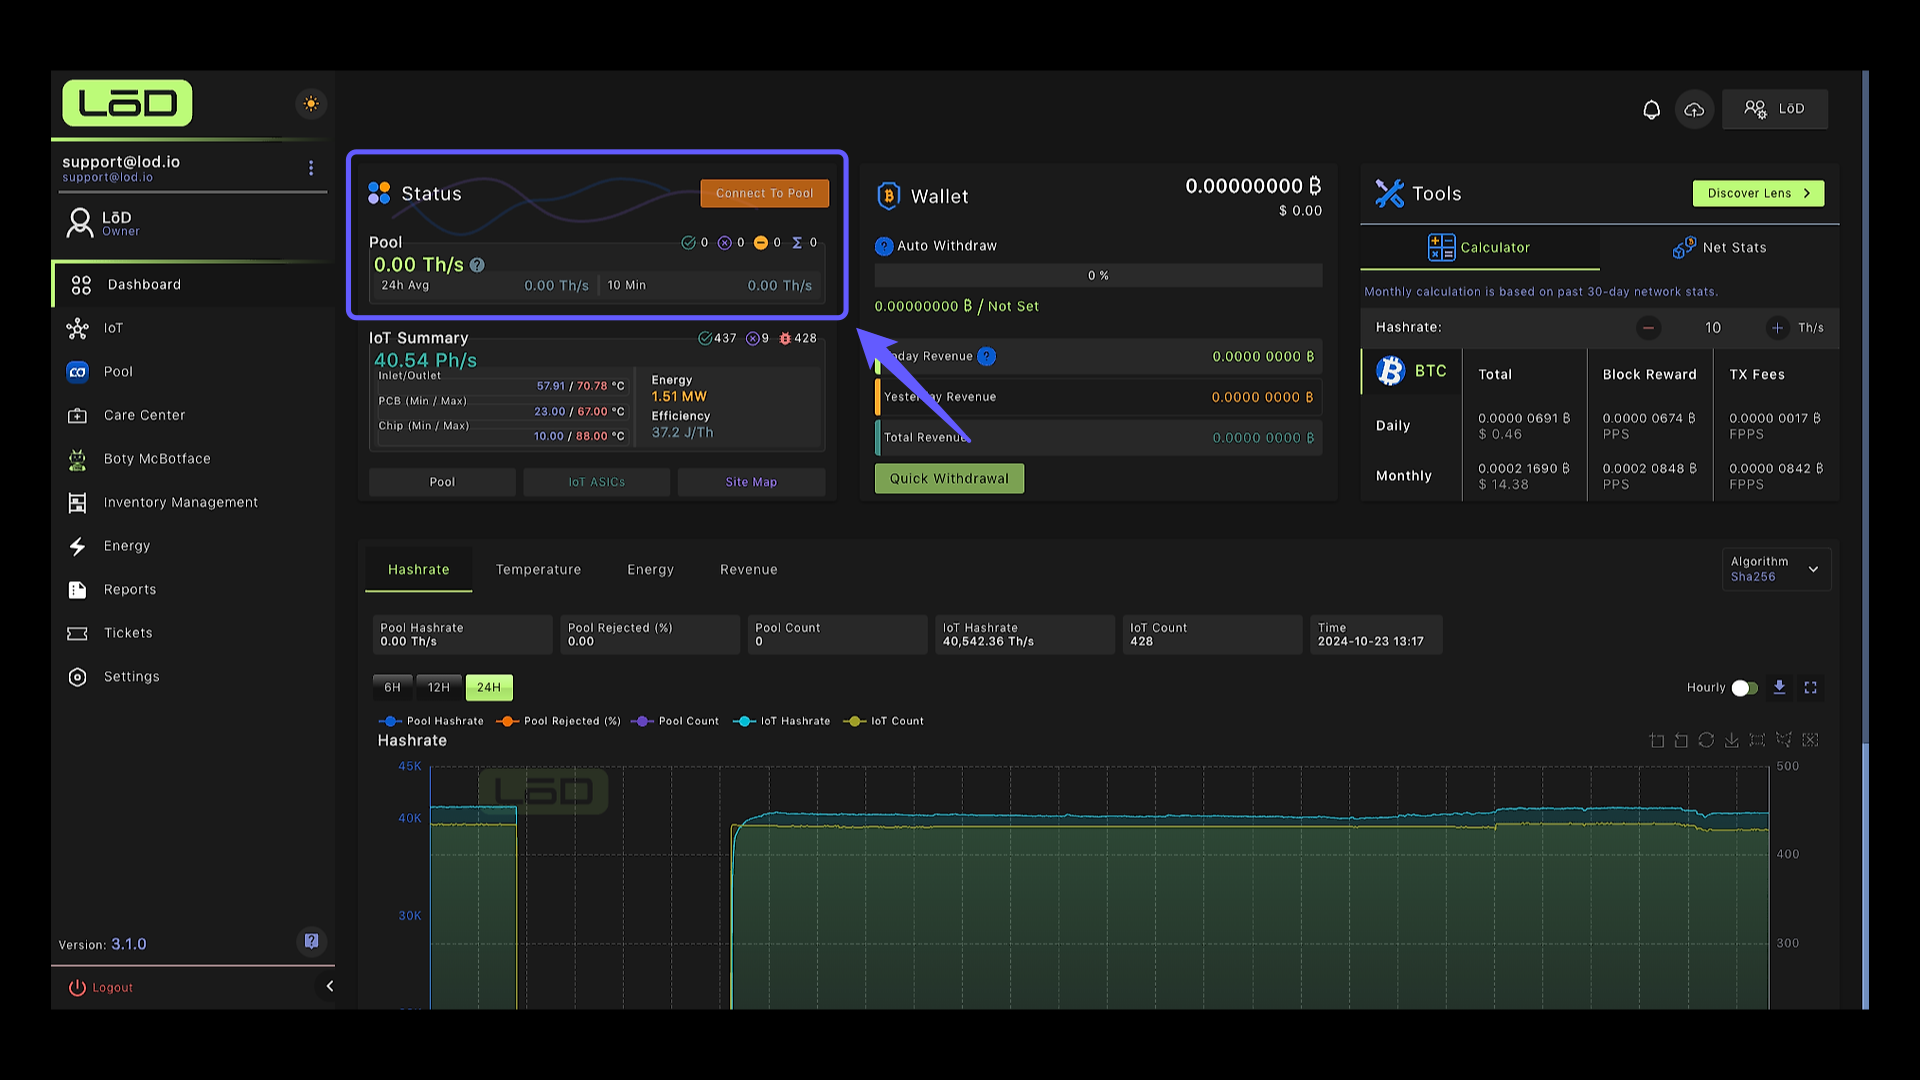
1. Your LōD Dashboard #
You can access your dashboard by logging in and immediately get an overview of your sites. In this section, you can look at your devices connected to the Lincoin Pool and your total 24-hour average and 10-minute average hashrate on the pool. If you are not connected to the Lincoin pool, you can do so by clicking on “Connect To Pool.”
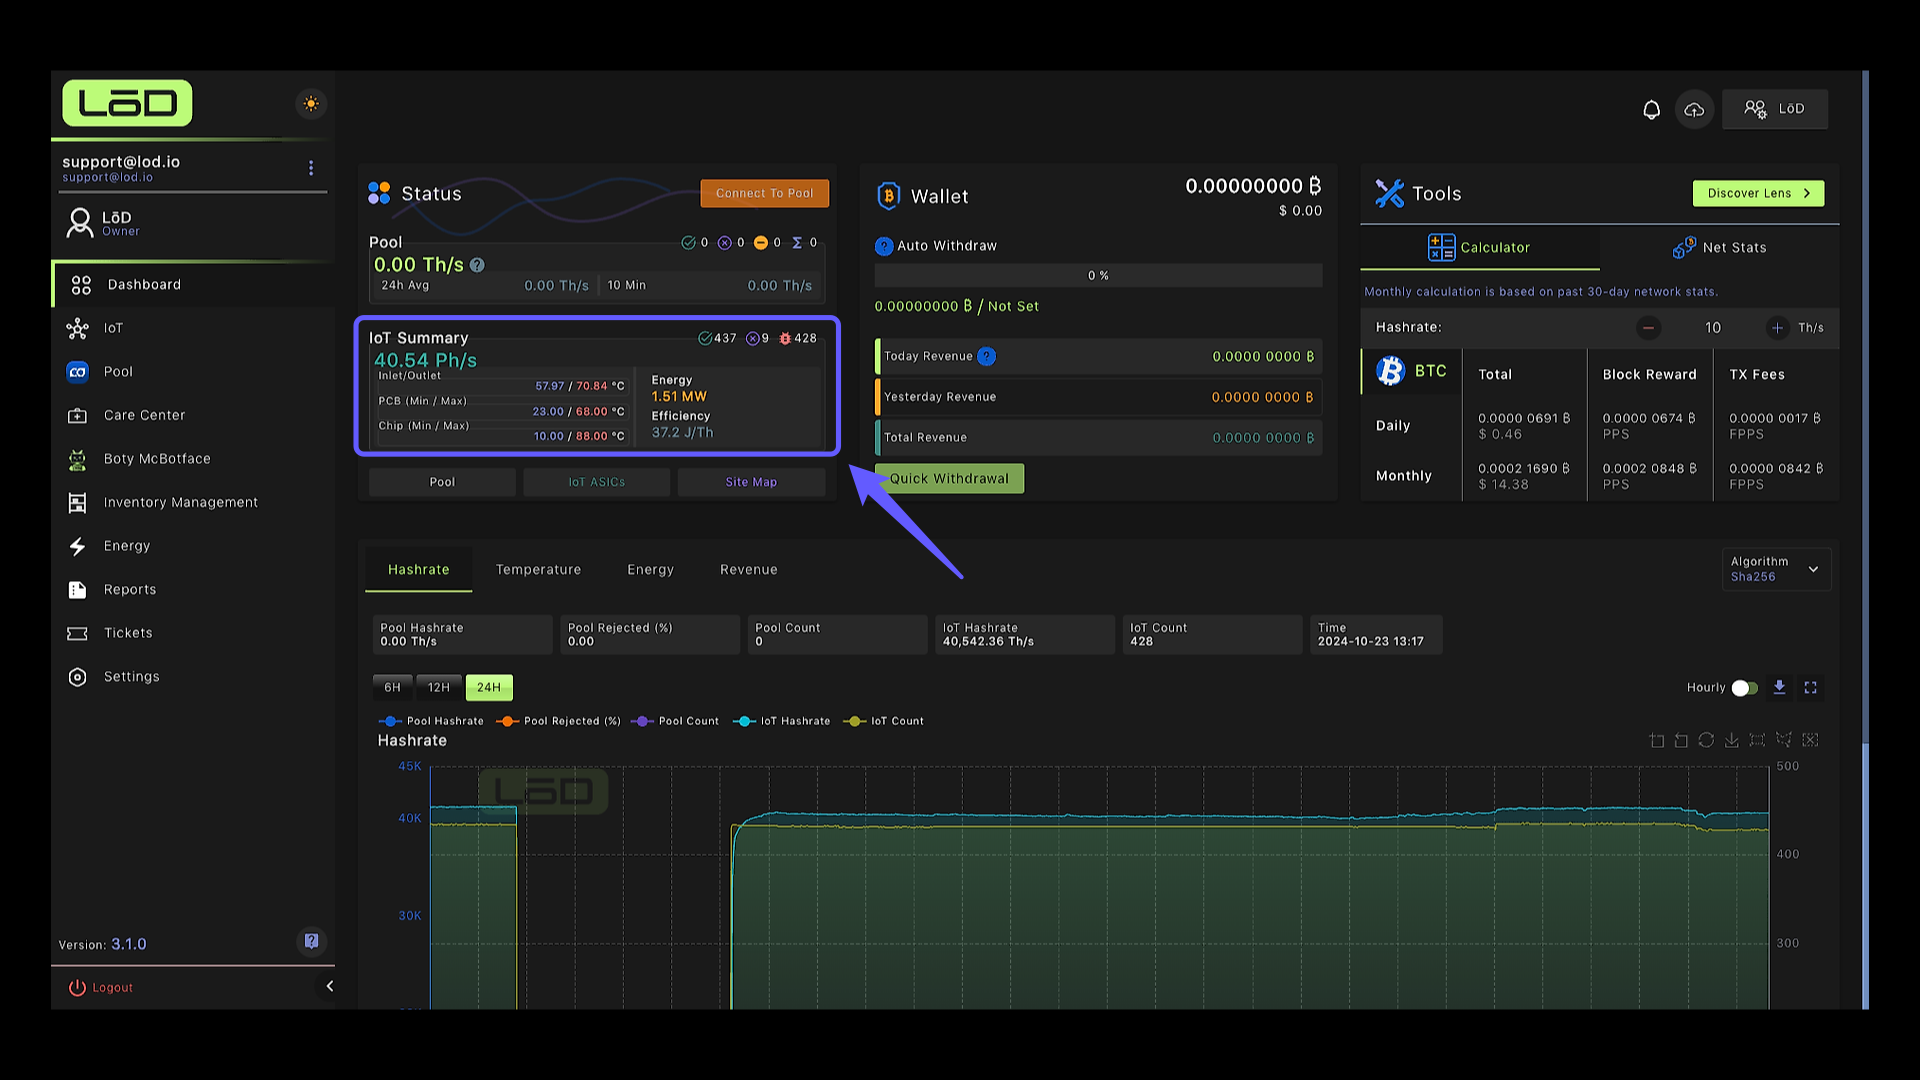
2. IoT Performance Summary #
In this section, you can see your site’s summary by viewing the total hashrate, number of connected and disconnected devices, and number of devices with issues. In addition, you can also see the average of your inlet and outlet temperatures, your PCB and Chip minimums and maximums, and any anomalies in your site. In this field, you can see your total energy consumption and average device efficiency.
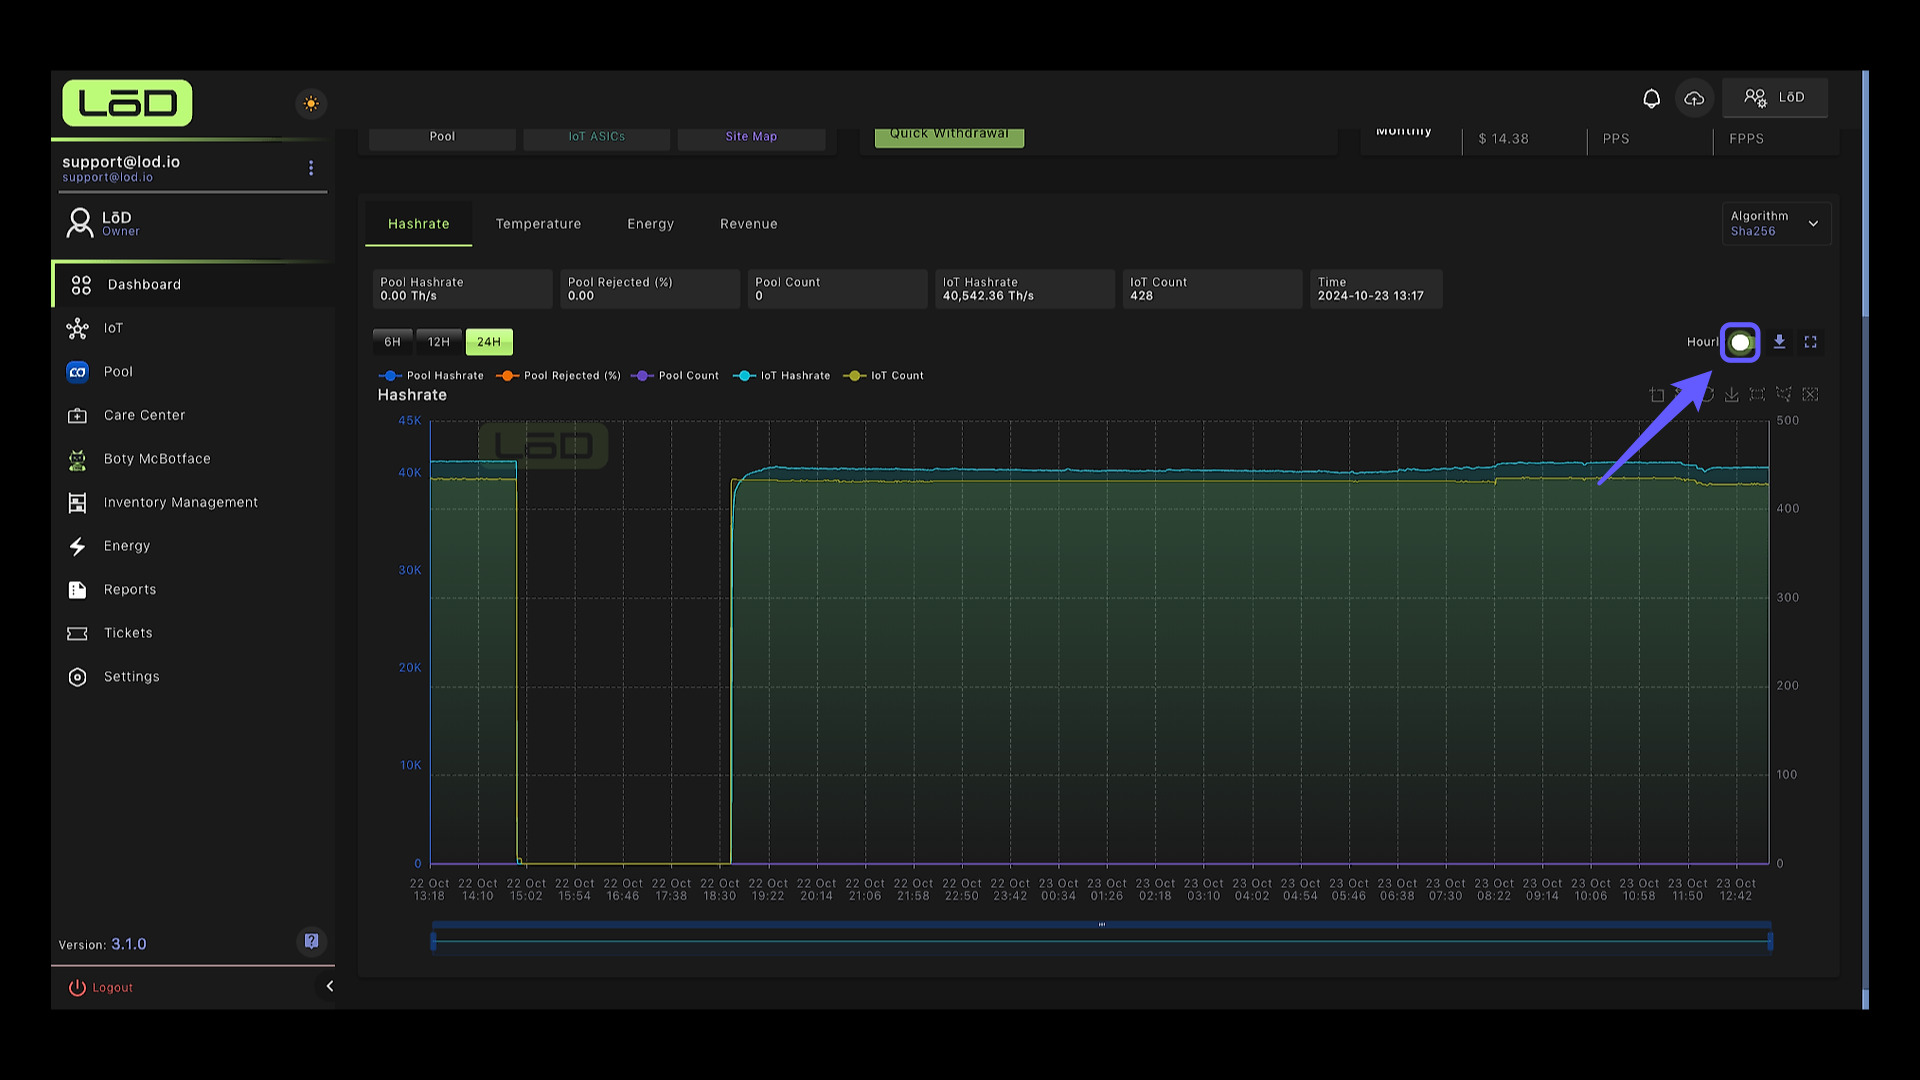
3. IoT Hashrate Graph #
You can visualize your hash rates in your dashboard by the hour or daily. It displays both your IoT hashrate that is captured through your devices and the hashrate that’s reported to the pool.
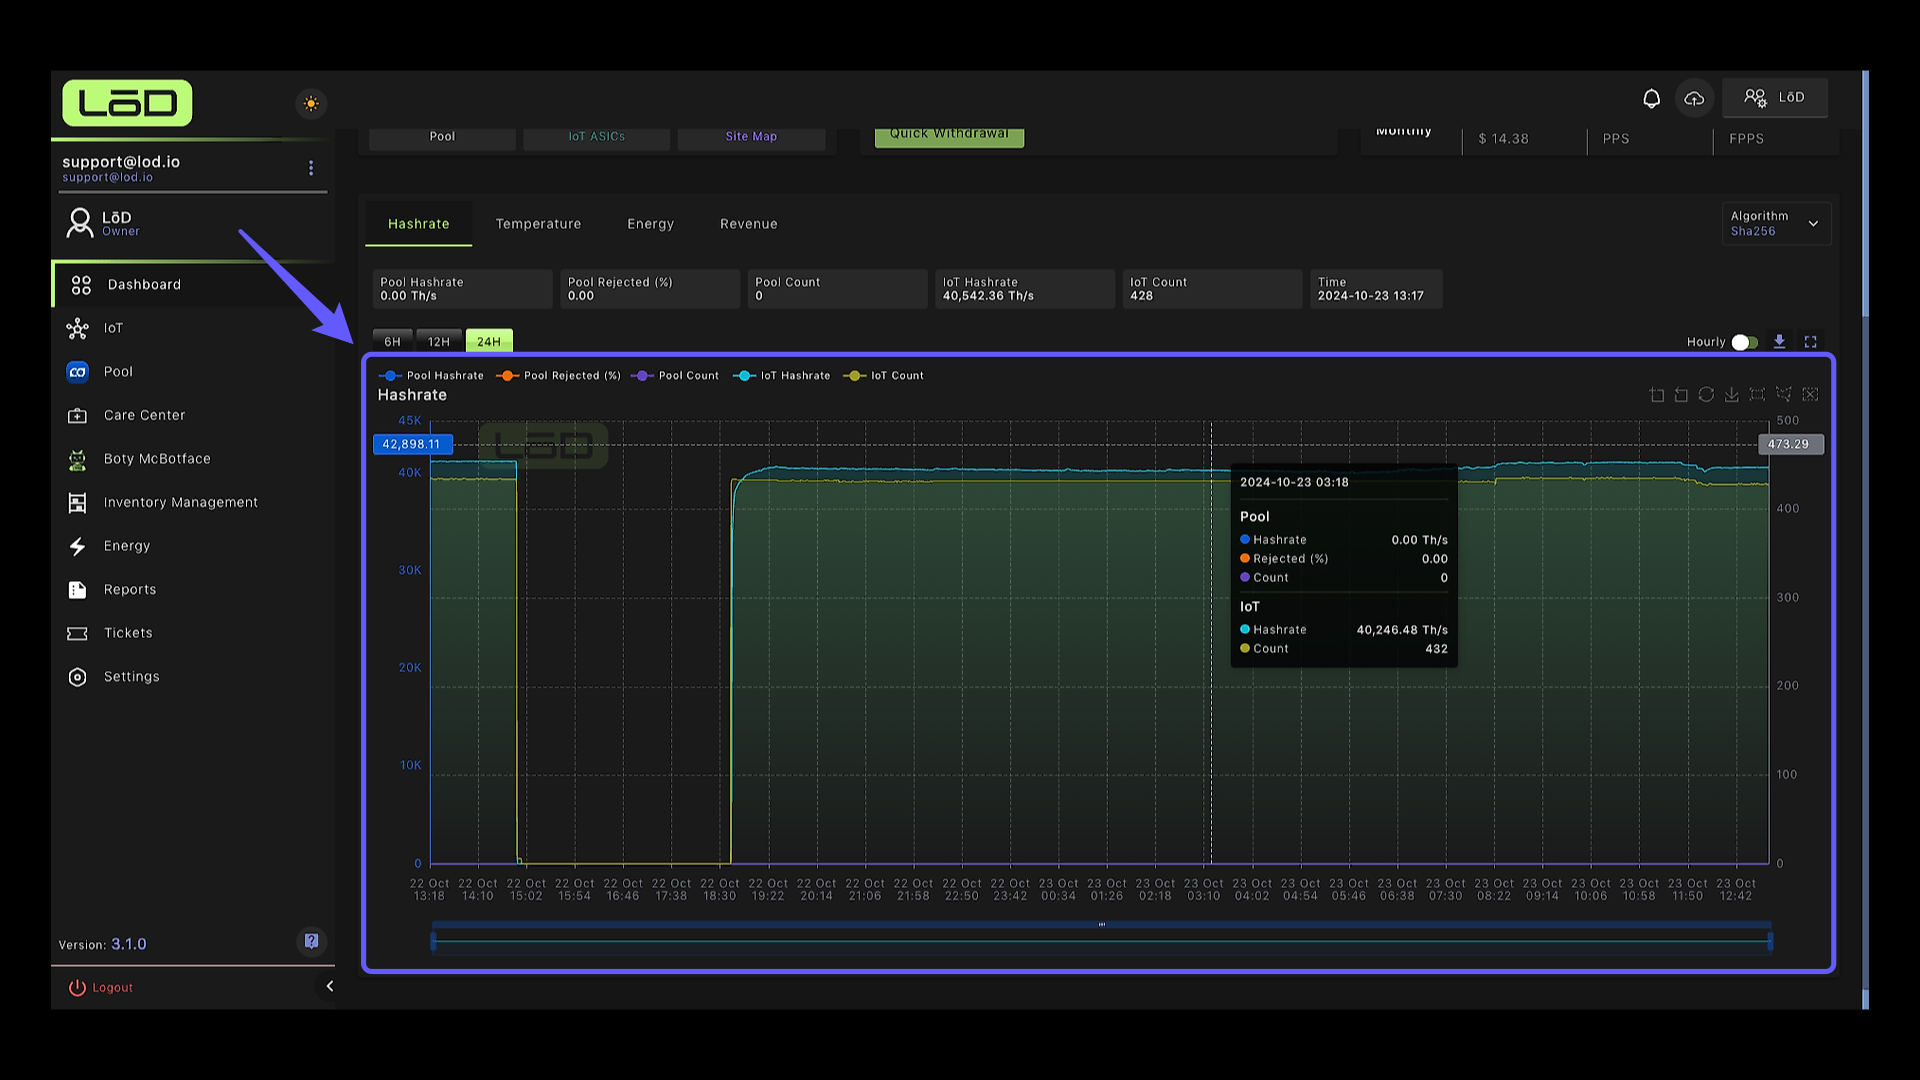
4. Hourly View and Daily View #
By toggling here, you can change your view from hourly view to daily view.
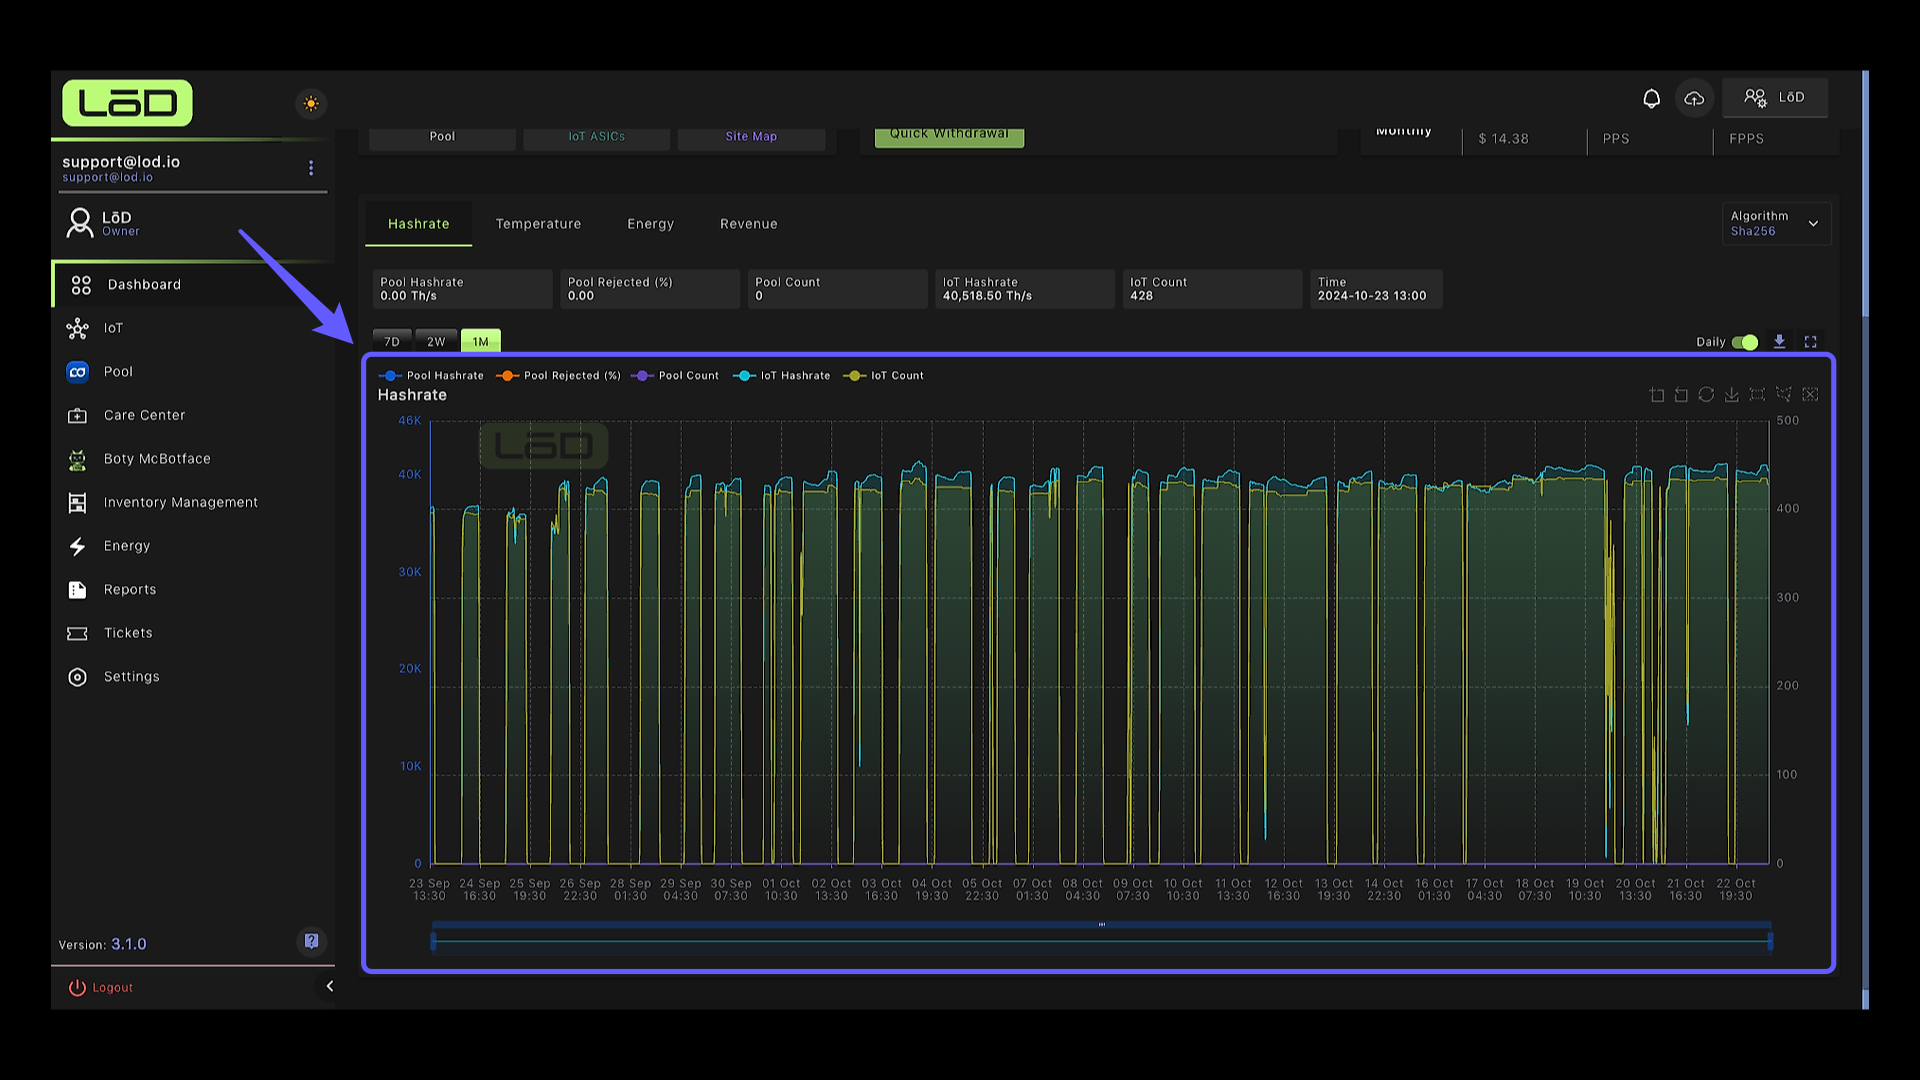
5. Daily Hashrate View #
We collect and retain 30 days of aggregated hashrate data you can view in your dashboard.
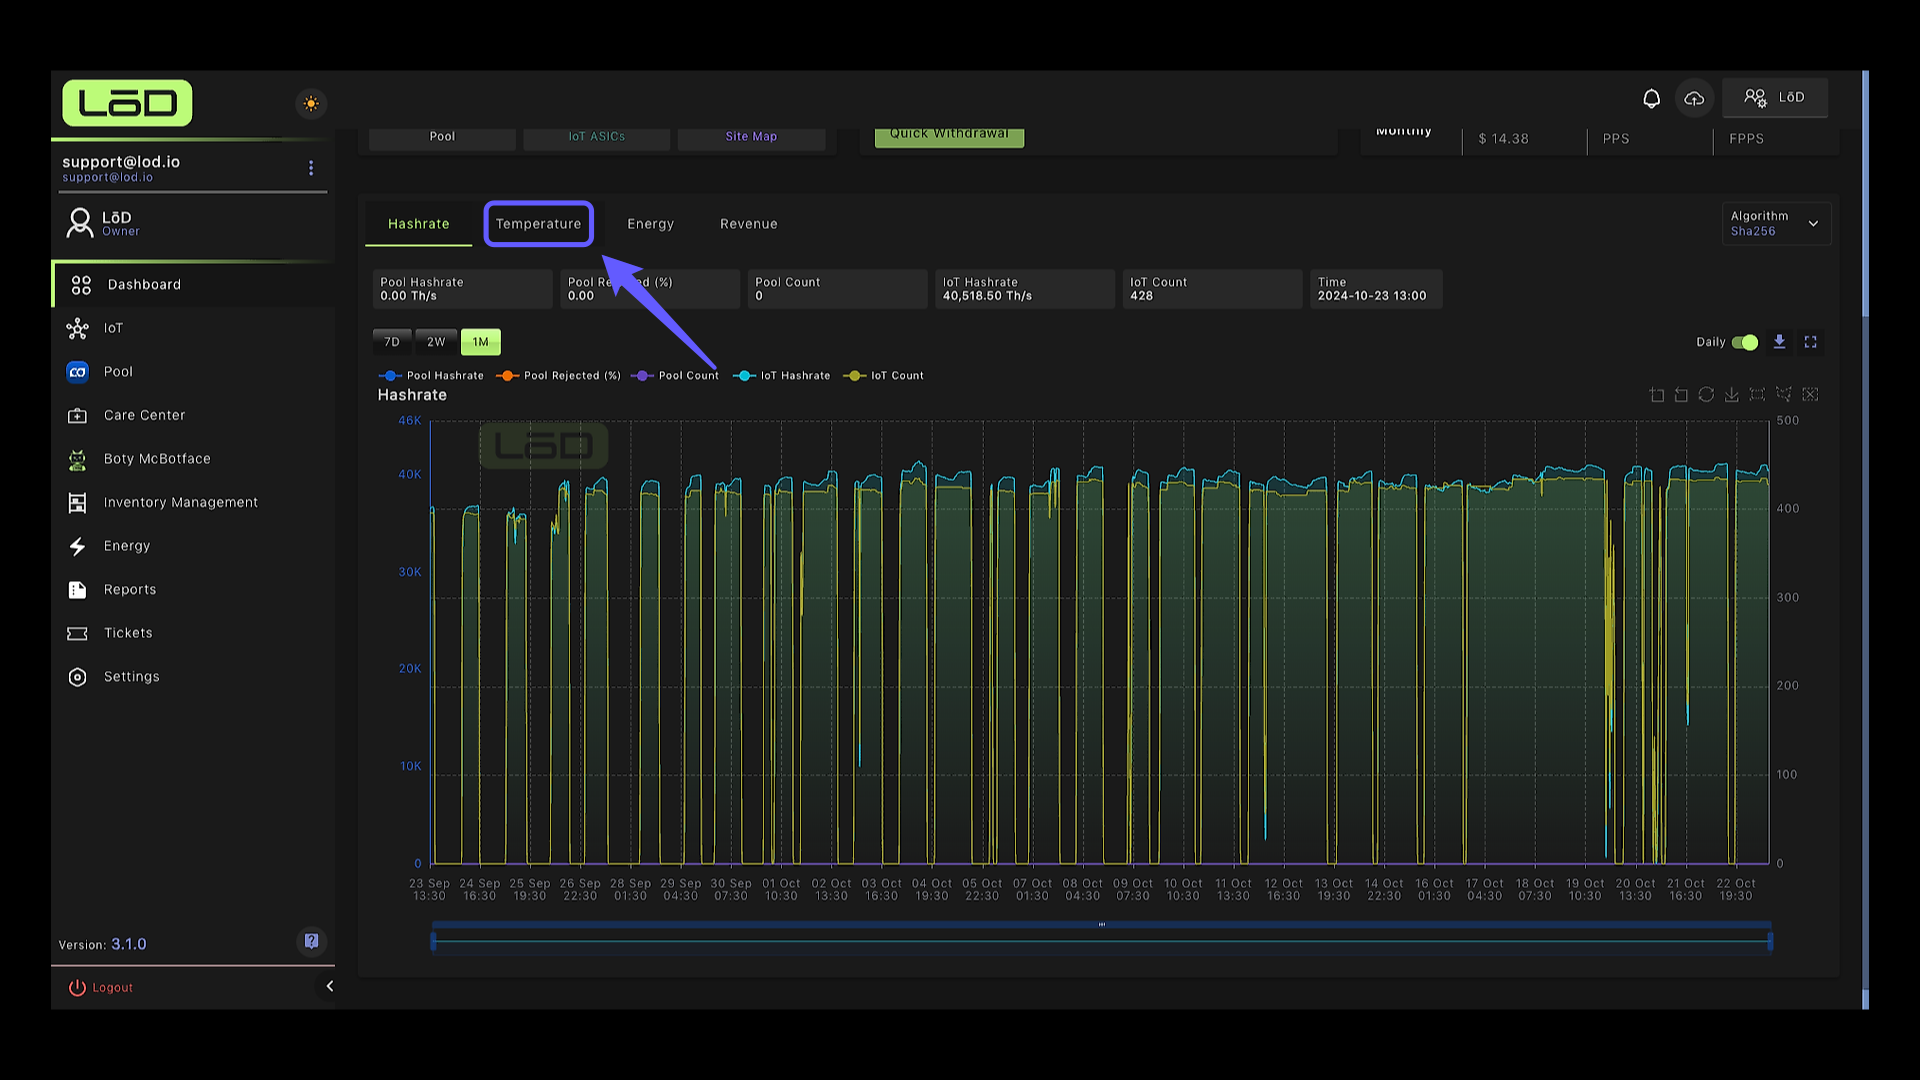
6. Temperature Tab #
By clicking on the temperature tab you can visualize your device’s aggregate temperatures.
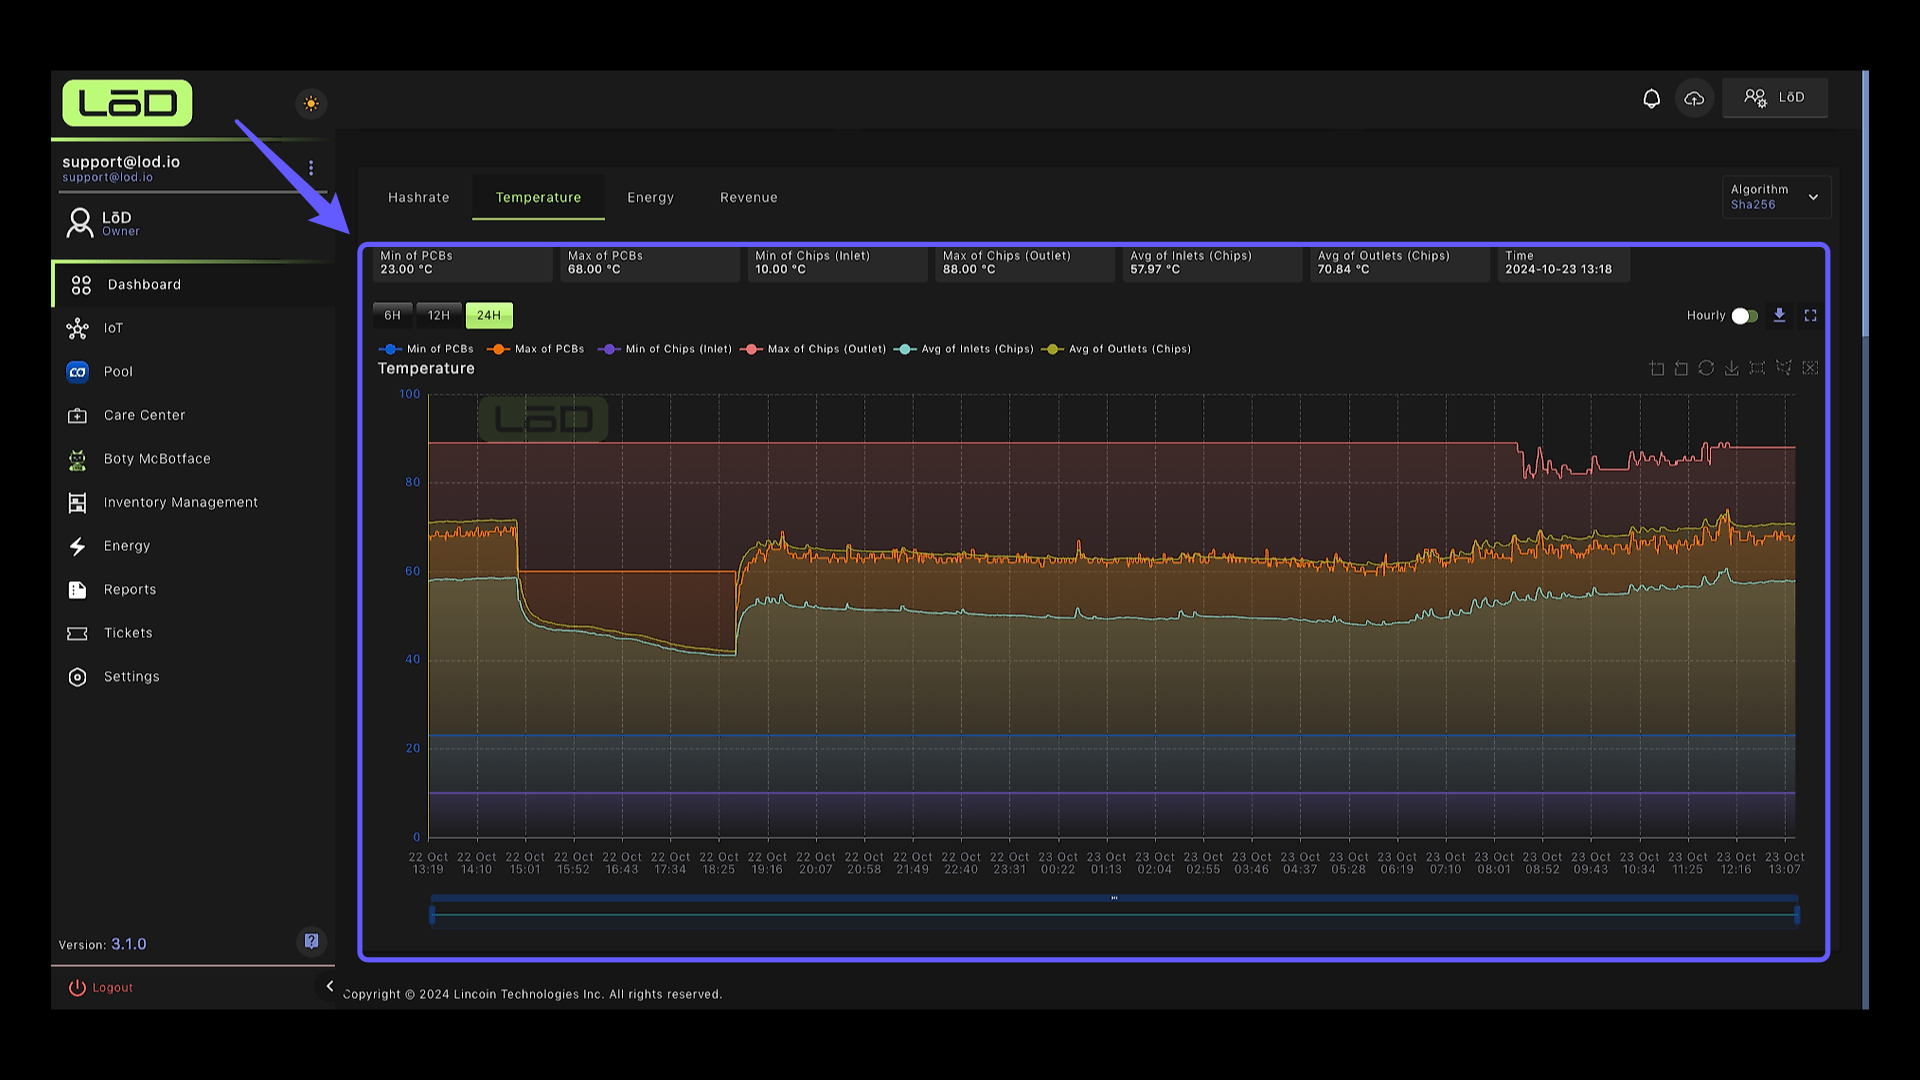
7. Temperature Tab #
You can visualize your minimum and maximum PCB and chip temperatures, along with an average of your inlet and outlet temperatures, both on an hourly basis and over 30 days.
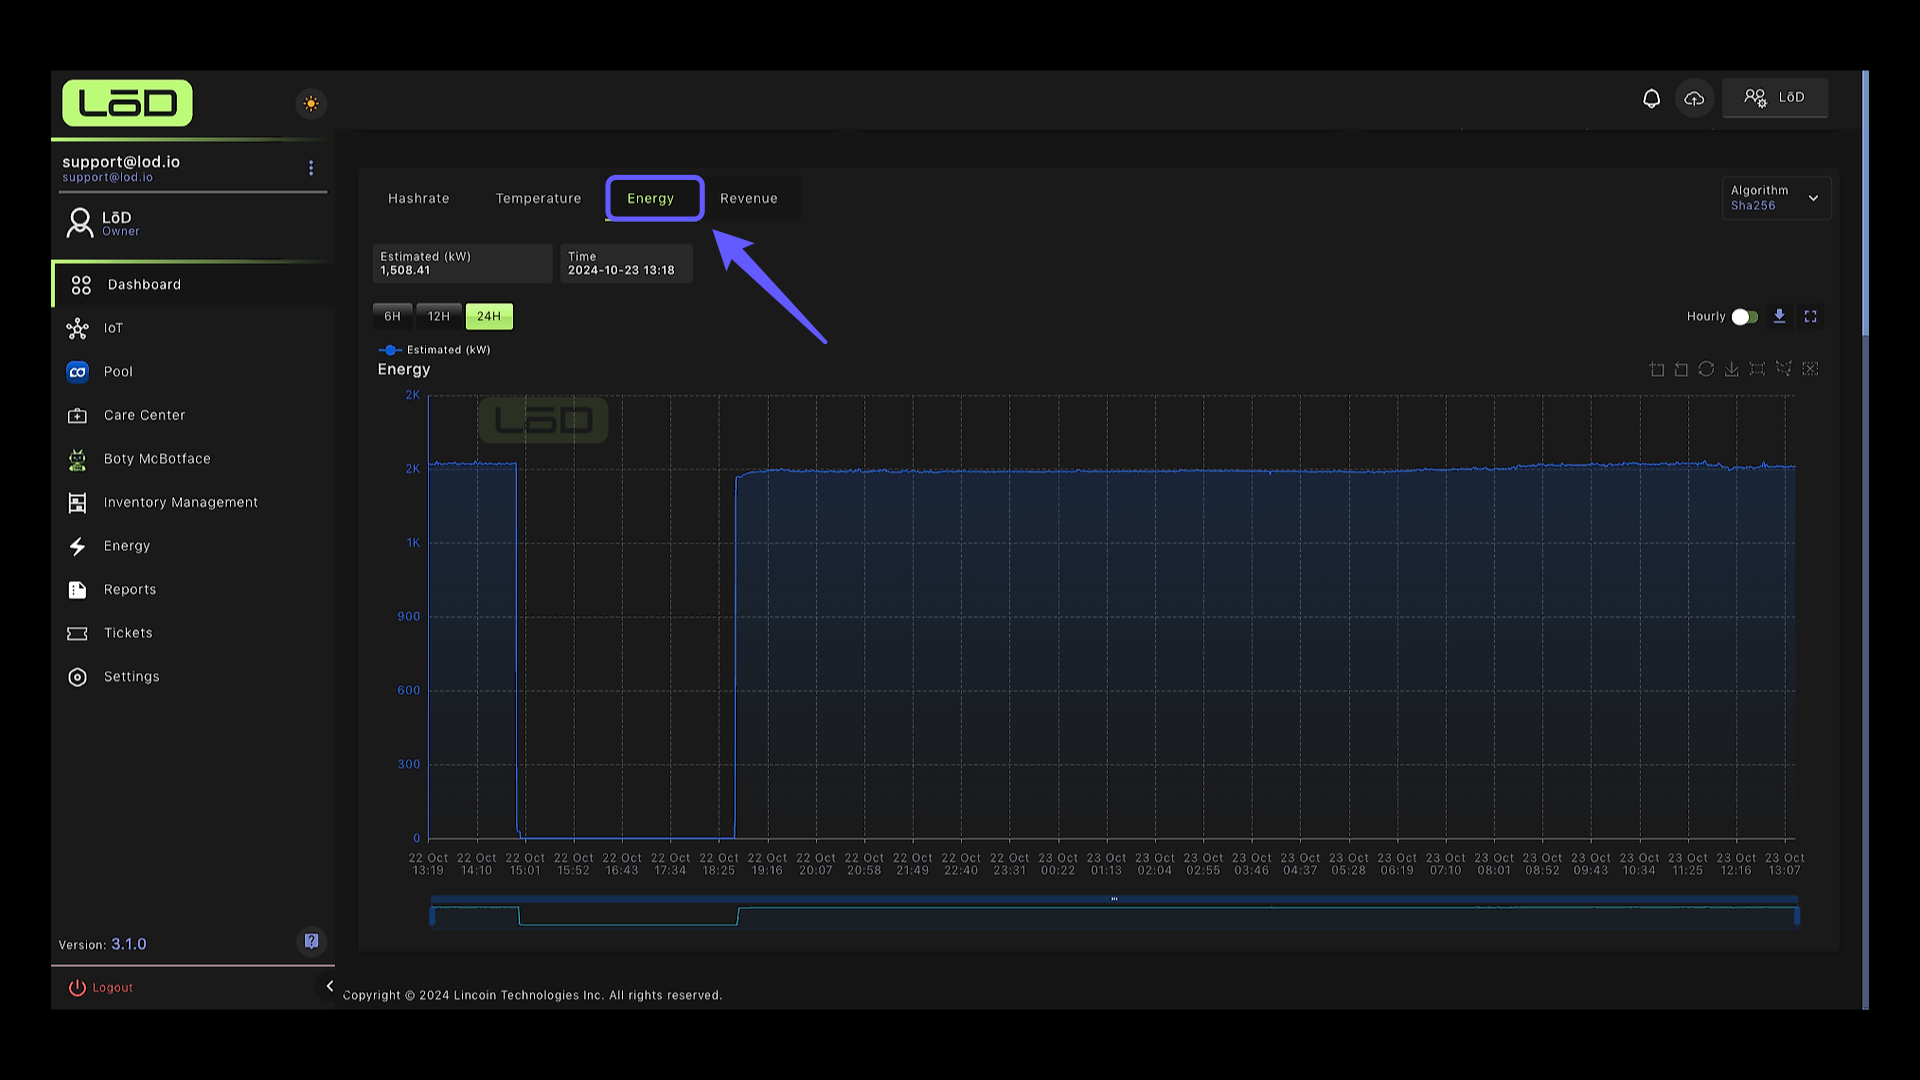
8. Energy Tab #
In your energy tab, you can see detailed data related to your energy consumption for up to 30 days.
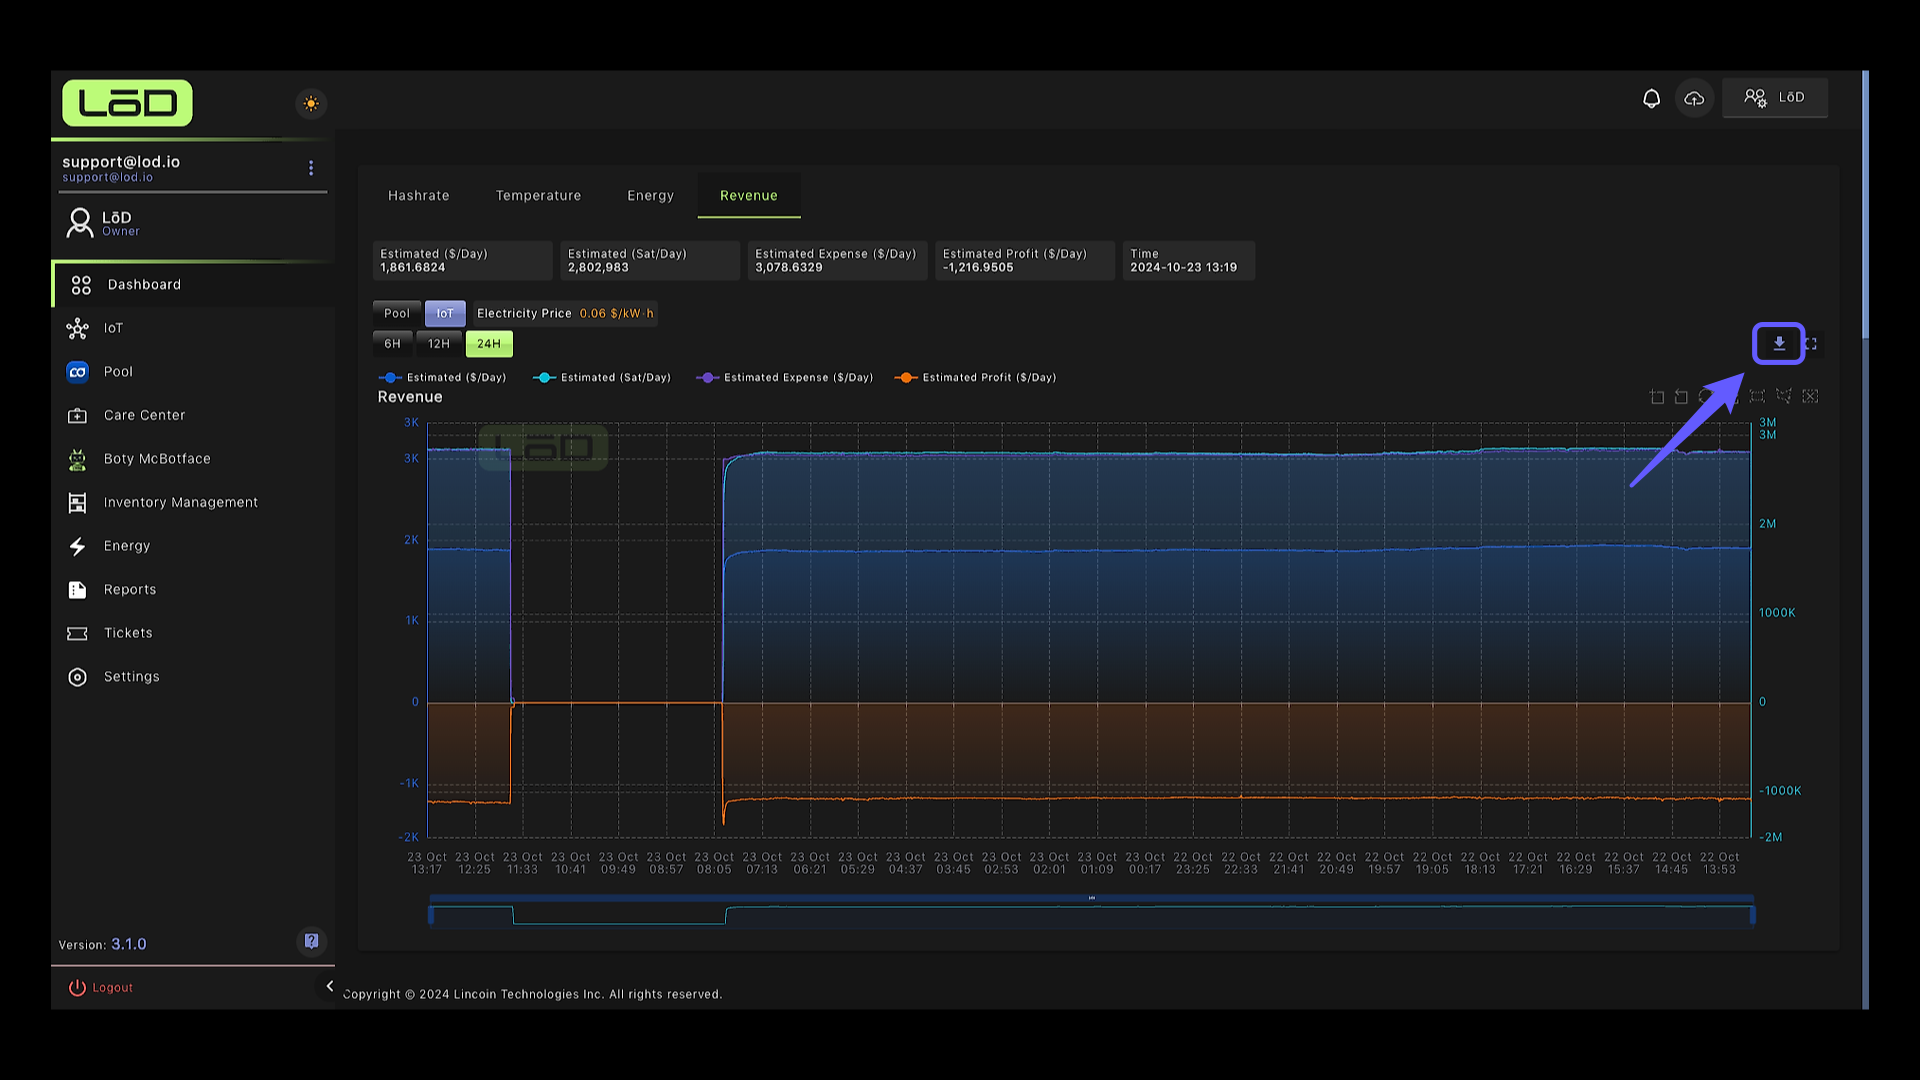
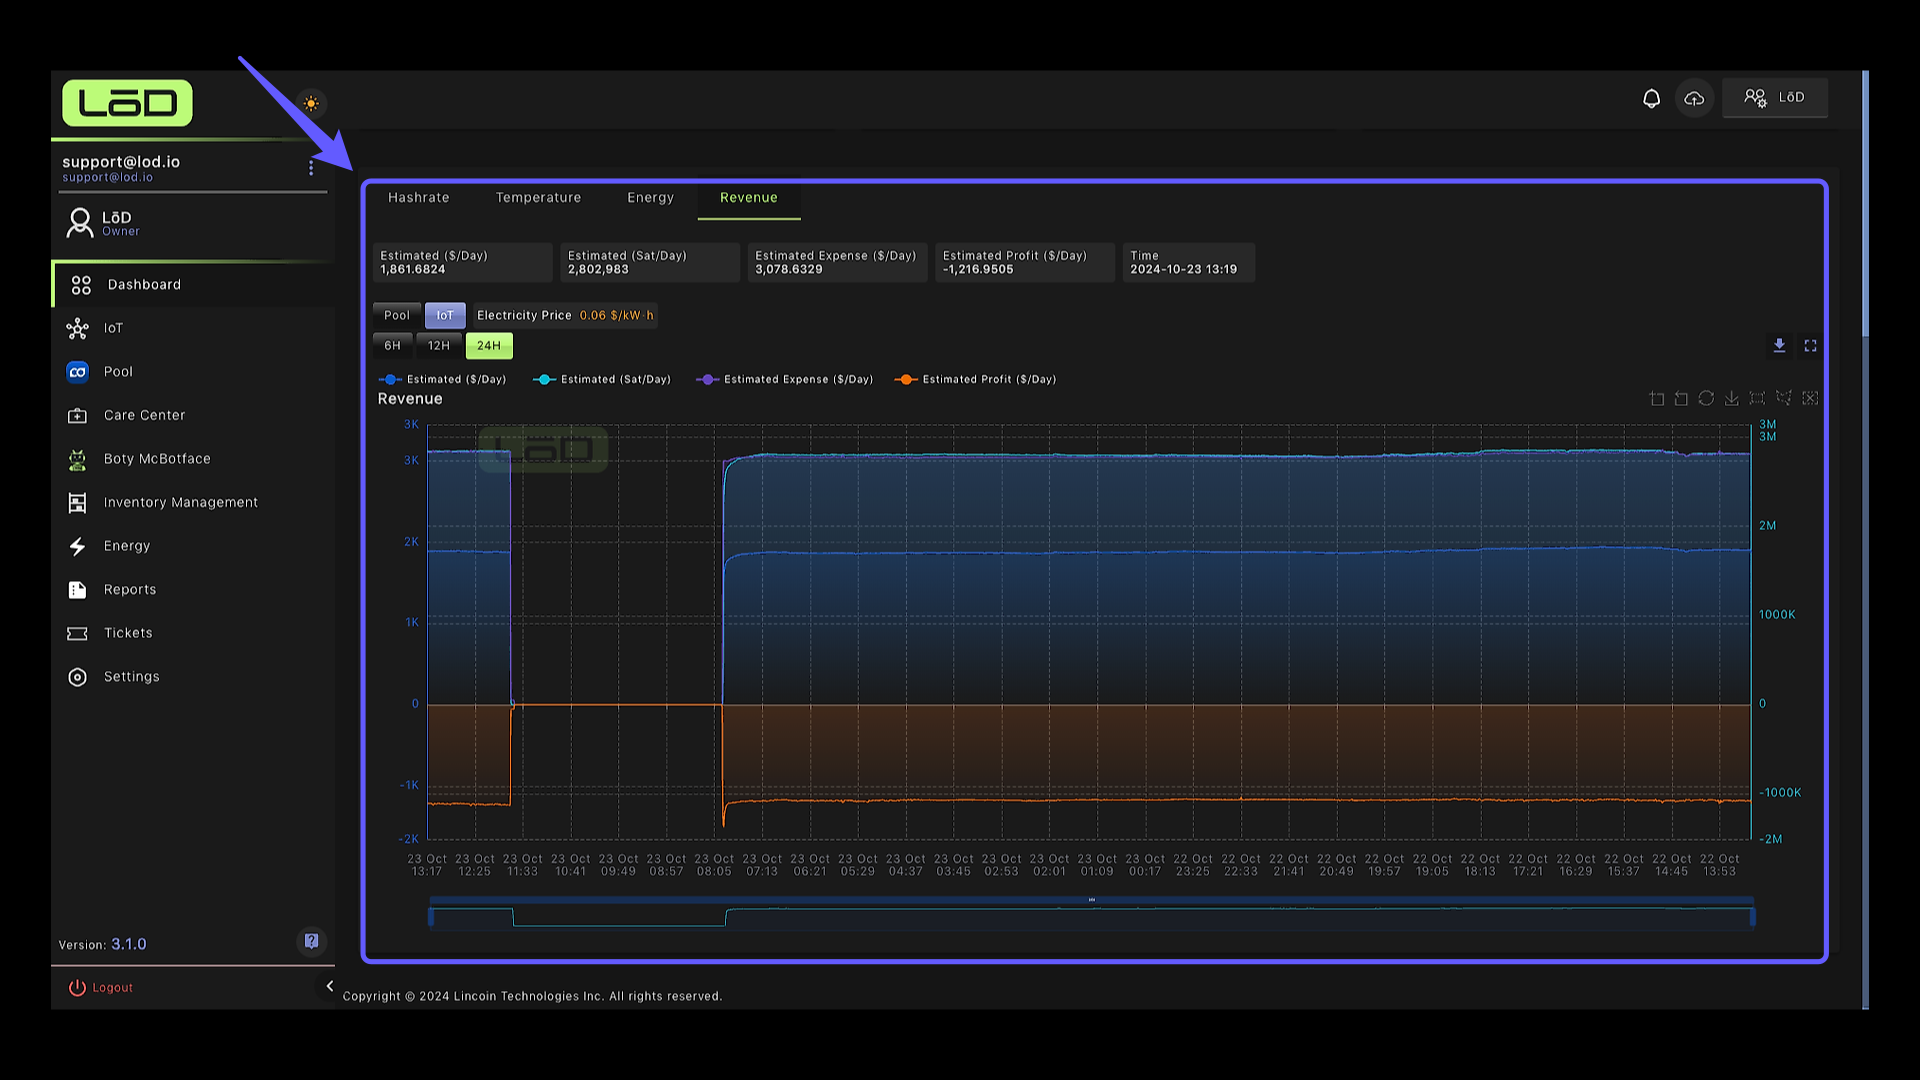
9. Revenue Tab #
In your Revenue tab, you can see your estimated revenue in dollars and sats, your estimated energy expenses, and your estimated profits in dollars per day. Your energy expenses are based on the electricity set on your account and can be adjusted accordingly.
10. Export Data #
You can export your site’s hashrate, temperature, energy, and revenue data by clicking here, which can be exported as csv and Excel.