Know exactly where
your hashrate stands
Hashrate Realization Index (HRI) gives you a real-world benchmark for your exact hardware model and conditions. Instantly identify underperforming machines and make decisions based on actual data, not lab specs.
Your current benchmark vs. HRI
- ✕ Set in a controlled lab environment
- ✕ Ideal temperature, stable voltage
- ✕ No seasonal or weather adjustment
- ✕ Static. Never reflects your reality
Chasing a number that was never yours to hit
- ✓ Millions of historical data points, filtered to your model
- ✓ Adjusted for your region, current season, and weather
- ✓ Aggregated and anonymized. No competitor data exposed
- ✓ Continuously refined as new fleet data flows in
The number your site actually delivers
See where you stand
The HRI distribution shows how every machine in your fleet compares to the aggregated index for that exact model. Built from millions of historical data points, filtered to match your region and current conditions. Your position, your delta, your underperformers — all at a glance.
- ✓Index is model-specific. S19j Pro is never compared to an S21
- ✓Pinpoint exactly which machines are underperforming and by how much
- ✓Filter by hardware model to isolate performance across your fleet
- ✓Worker counts per realization bucket. No guessing how many machines are affected
↗ 30 workers benchmarked against 400+ peers running the same model in your region.
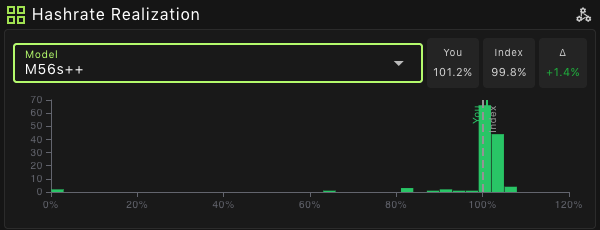
S19j Pro fleet · 103.0% realization · +3.9% above index
Millions of data points matched to your setup
The HRI index is derived from millions of historical performance data points filtered to match your specific hardware model, then cross-referenced against live data from your region, season, and weather conditions.
You're not seeing competitor data. You're seeing an anonymized, aggregated benchmark built specifically for your gear and your conditions. No individual operator data is ever exposed.
- ✓Millions of historical data points power the index. Not a single snapshot
- ✓Filtered to your exact hardware model. No cross-model comparisons
- ✓Live factors applied: current season, regional weather, power profile
- ✓Fully anonymized. Individual operator data is never visible
Identify underperforming machines instantly
Every bar in the distribution is clickable. Select any realization range and immediately see exactly which machines fall in it — model, realization %, and worker count. Then open them directly in your ASIC view to investigate or act. No spreadsheets. No manual cross-referencing.
- ✓Click any bucket to immediately identify the underperforming machines
- ✓See model, realization range, and worker count in one view
- ✓Jump directly to those ASICs to take action. One click
- ✓Make better decisions based on real data, not nameplate assumptions
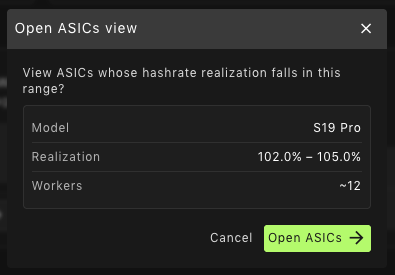
Selected: S19 Pro · 102%–105% range · ~12 workers · Open in ASIC view →
Read your fleet in seconds
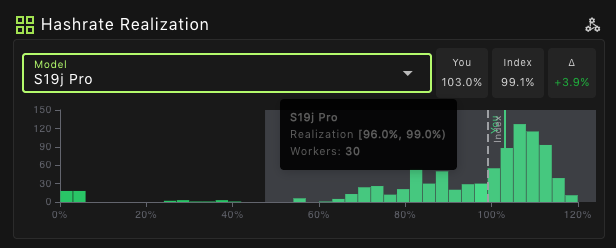
A tight cluster near the index means your fleet is consistent and performing as expected. A wide spread with a long left tail means underperforming machines are silently dragging your average down.
- ✓Tight cluster = fleet is consistent and hitting the index
- ✓Left tail = underperformers to investigate. Now you can see exactly which ones
- ✓Right tail = machines beating the index. Learn from what's working
- ✓Available for every hardware model in your fleet
Up and running in seconds
HRI is built into your LōD IoT dashboard. No setup, no integrations. Just open it and start benchmarking.
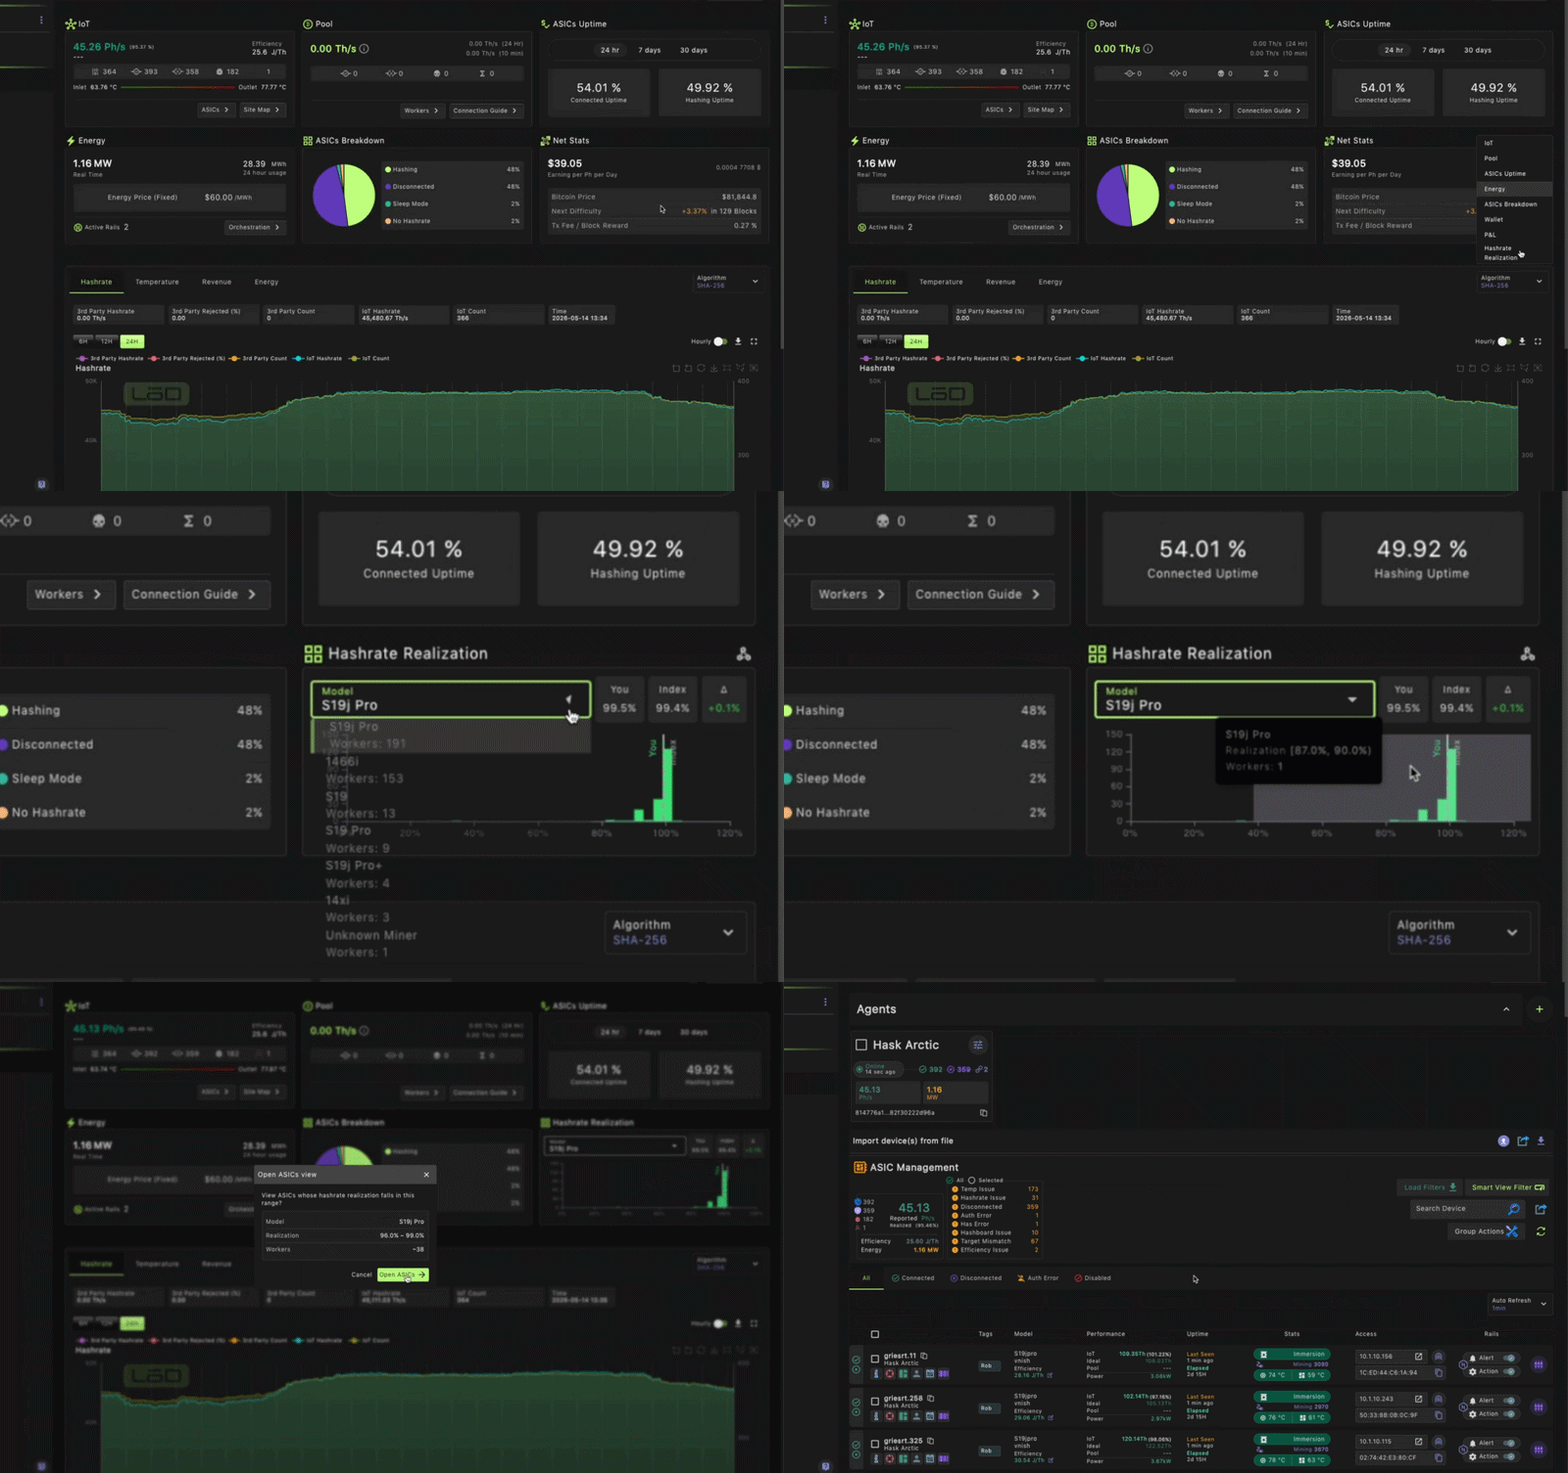
HRI is already running
inside your LōD dashboard
If you're on LōD, HRI is live. Open your IoT dashboard and look for the Hashrate Realization panel.